Analytics
Track viewer engagement, notifications, and extension usage with the StreamLayer Studio Analytics dashboard and CSV data export.
StreamLayer collects analytics that you can view on the Admin Control panel. Log into https://studio.streamlayer.io/ and click on the Analytics button on the left side menu to get started.

Control Bar
As you can see from the image above, as you host more and more live streams with StreamLayer, the list of events to view analytics from will build up over time. To narrow your search, the control bar (image below) can help you filter the list shown on screen by specifying a given date range. Click on “from” and “to” to expand or narrow the amount of data explained on this screen. You can also click on the “Search” in the upper right hand corner of the screen to help find a specific event.

Remember that Analytics are best populated for historical or live events. Once you click into an event, navigate to the Analytics tab at the center top of the page.
Overview Image
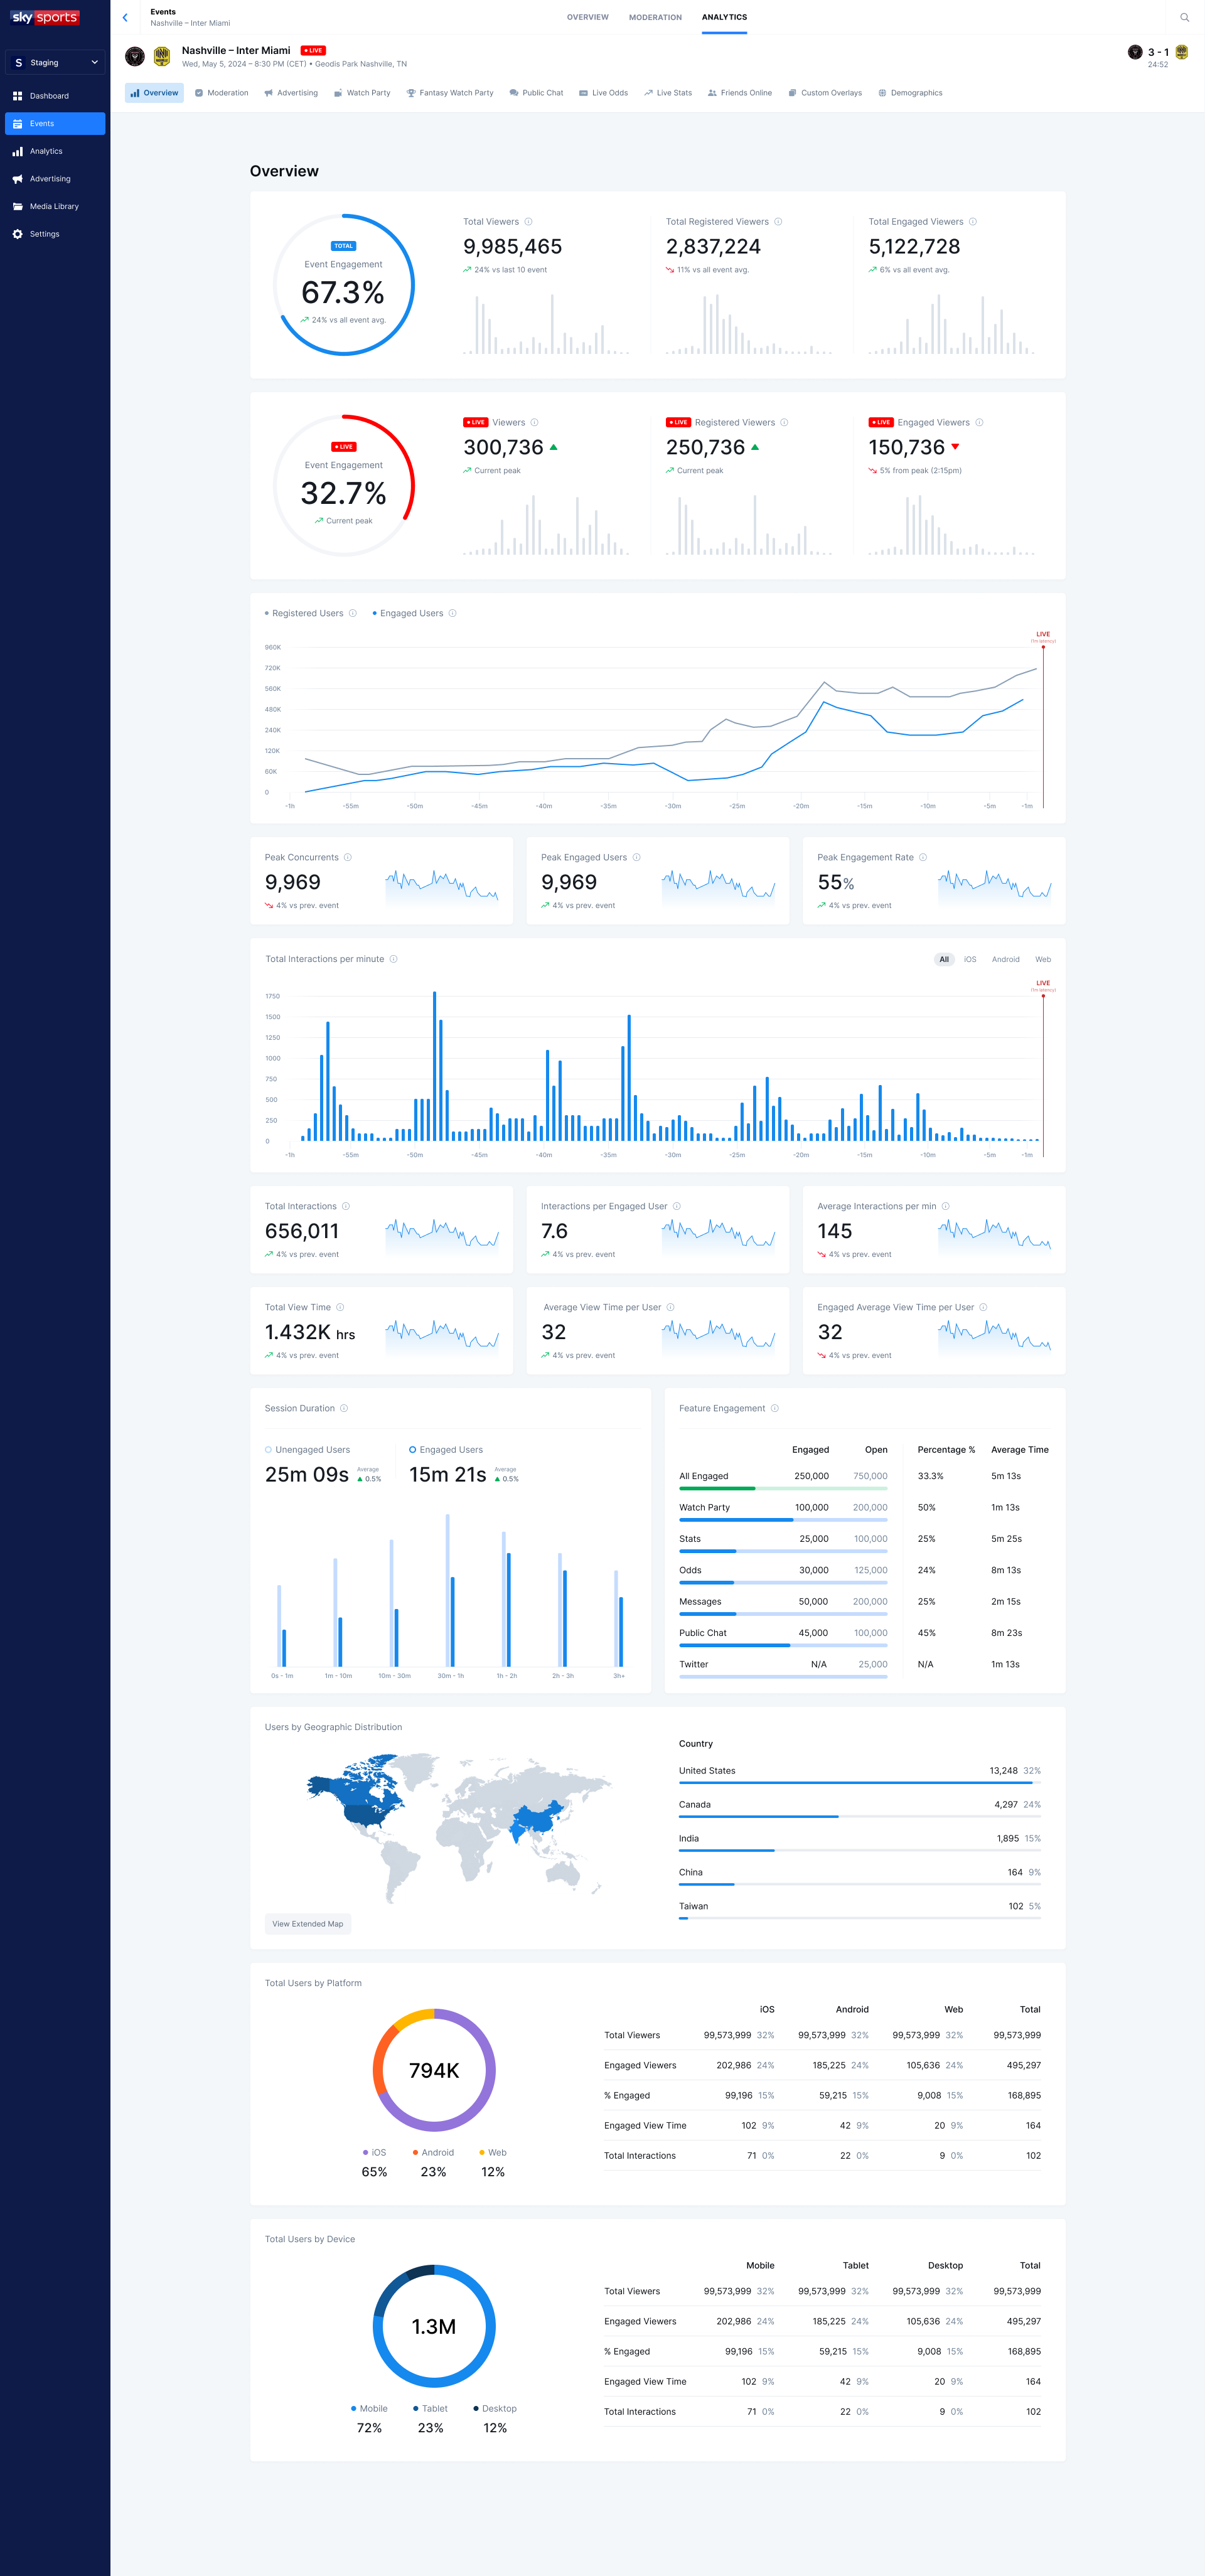
The Analytics tab of any event page shows an overview of all the analytics captured for the event. The image below shows a typical analytics page for an event. We will delve into specifics of the information further on in the document.
Top Line Stats
Engagement
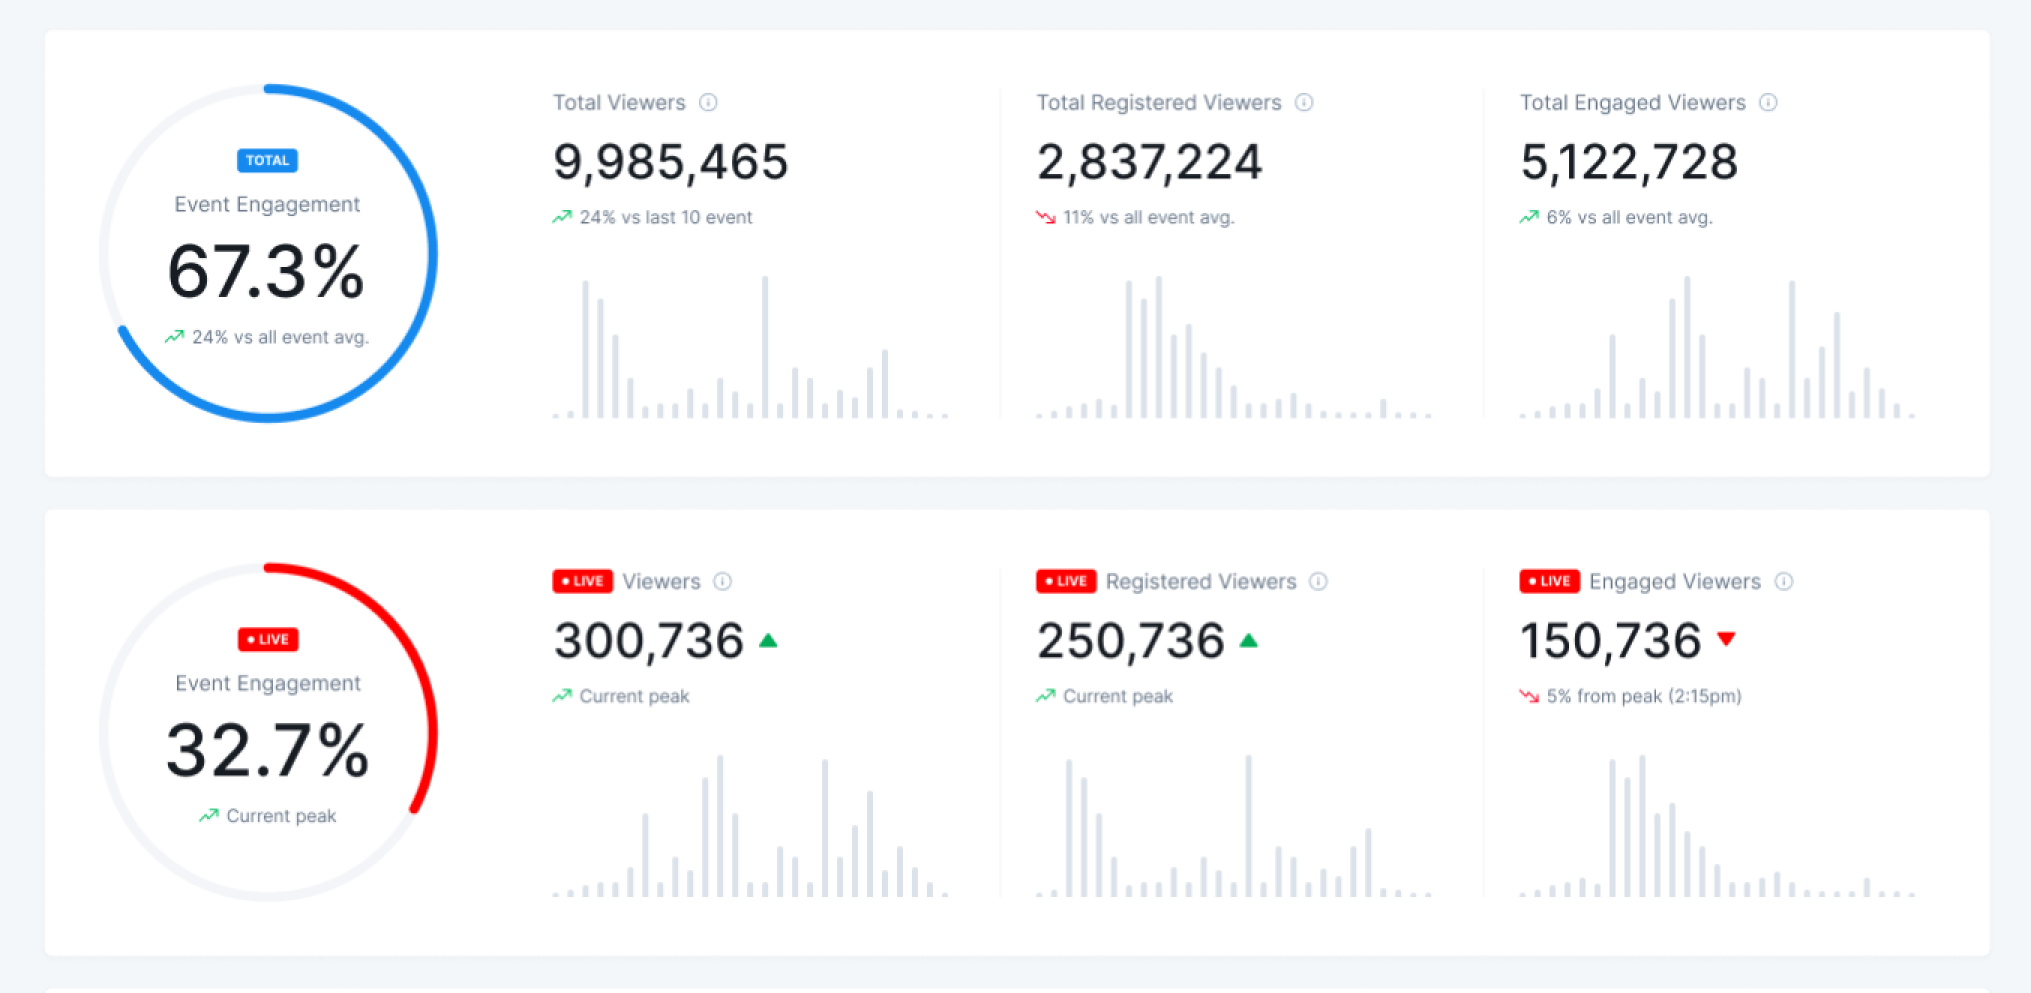
The first thing you will notice is the top line stats, which are shown across the top of the page. This top row measures the user engagement information for the event. You will see the total number of viewers, how many are “engaged” and what percent of total viewers are “engaged.” A viewer is anyone who watched the stream - counted with the “button initialized” tracking event. We consider a viewer “engaged” if they activate a StreamLayer Element either by 1) selecting a notification or 2) selecting the launch button then a submenu button. We count them with the “interaction” tracking event. If a user has at least one “interaction” tracking event fired, that means that we count them in the “total engaged” metric.
Live Viewers
The next box shows the current number of live viewers for the live stream over the last five minutes, as w$ell as an indication of the trend.
Live Engagement
The third box shows the current number of total engaged viewers over the last five minutes. It will also show the percentage of current viewers who are engaged.
Total Interactions
The fourth box shows the total number of interactions across all viewers. This includes all tracking events that the mobile SDK fires: button initialized, launch button, engagement, conversations, calls, invites, and permissions.
Invitations
The final box on the far right is the number of invitations that have been sent out by your viewers.
Event Graph
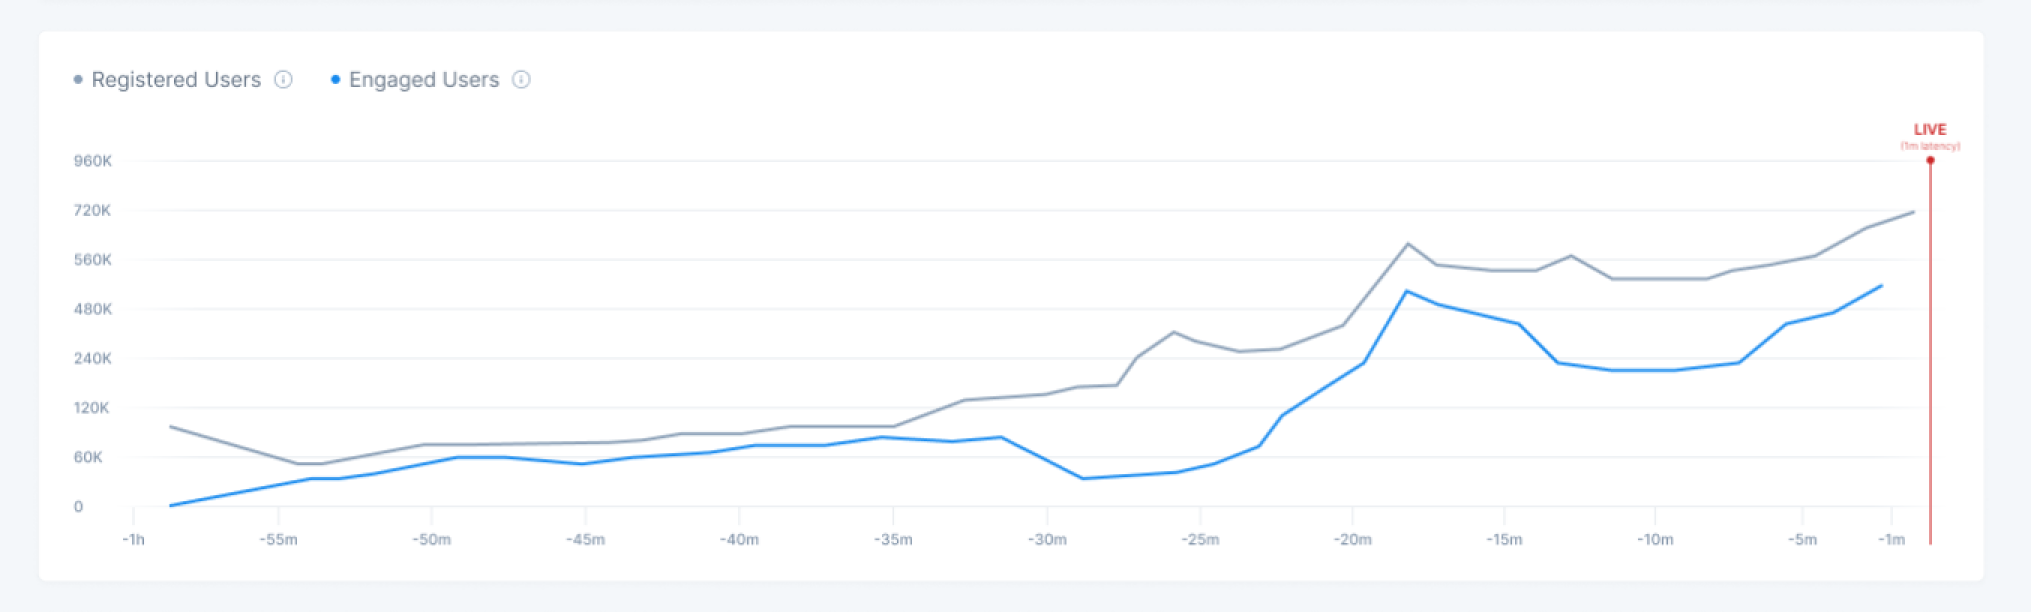
The next section of the screen is the Event Graph (shown above). The Event Graph allows you to visually track the analytics over time during the event. The X-axis is the event duration with the event starting at the left side of the graph. You can select from the following pools of data to visualize:
- Total Viewers / Engaged Viewers
- Messages
- Stats
- Invitations
NOTE: Note: on the Viewers tab and the Invitations tab you will see two different colored bar graphs. For viewers, the lighter color represents the total viewers while the darker color represents engaged viewers. On the Invitations tab, the lighter color represents invitations sent and the darker color represents invitations accepted.
Conversations

Beneath the viewership graph, the next row of boxes details Conversations. Conversations break down data about the kinds of interactions happening. How many video calls, how many group chats, how many messages are flowing back and forth between your viewers:
- Total Conversations - the number of all new conversations created during the stream. We can count them with the conversation created tracking event.
- Participants (Messaging) - the number of people who have participated in a text chat. We count them with the “participantsCount” property of the conversation created tracking event.
- Group Participants (Messaging) - the number of people who have participated in a text chat of 3 or more participants. We count them with the “participantsCount” property of the conversation created tracking event.
Notifications
Underneath the “Conversations” area you will see a “Notifications” area. This box contains several metrics related to notifications viewed and engaged with.
- Messaging - the total number of messages viewed, with a breakdown of a percentage of notifications that were tapped on (engaged) and a percentage of the total viewers that tapped on a notification during an event. We count messaging notifications with “notification received” and “notification opened” tracking events.
- Twitter Notifications - the total number of twitter notifications (in-app) through the event. Engaged shows how many notifications that were tapped, while % of total viewers shows the percentage of users who were engaged with the notifications. We count call notifications with “notification received” and “notification opened” tracking events.
Extensions Engagement
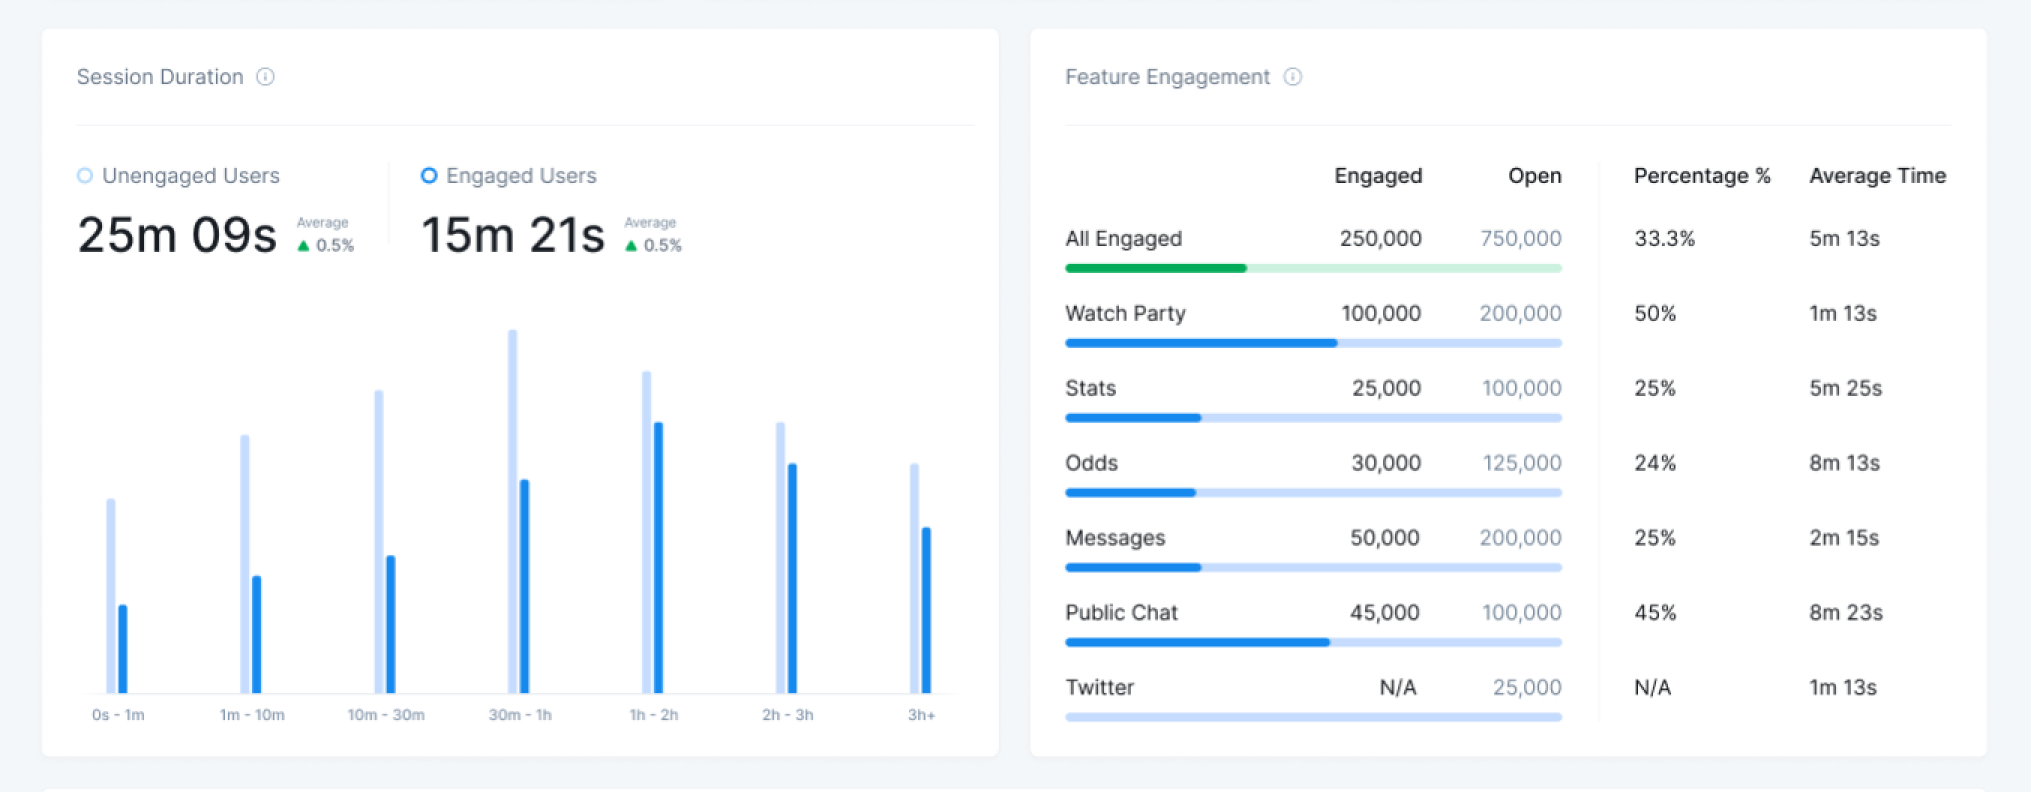
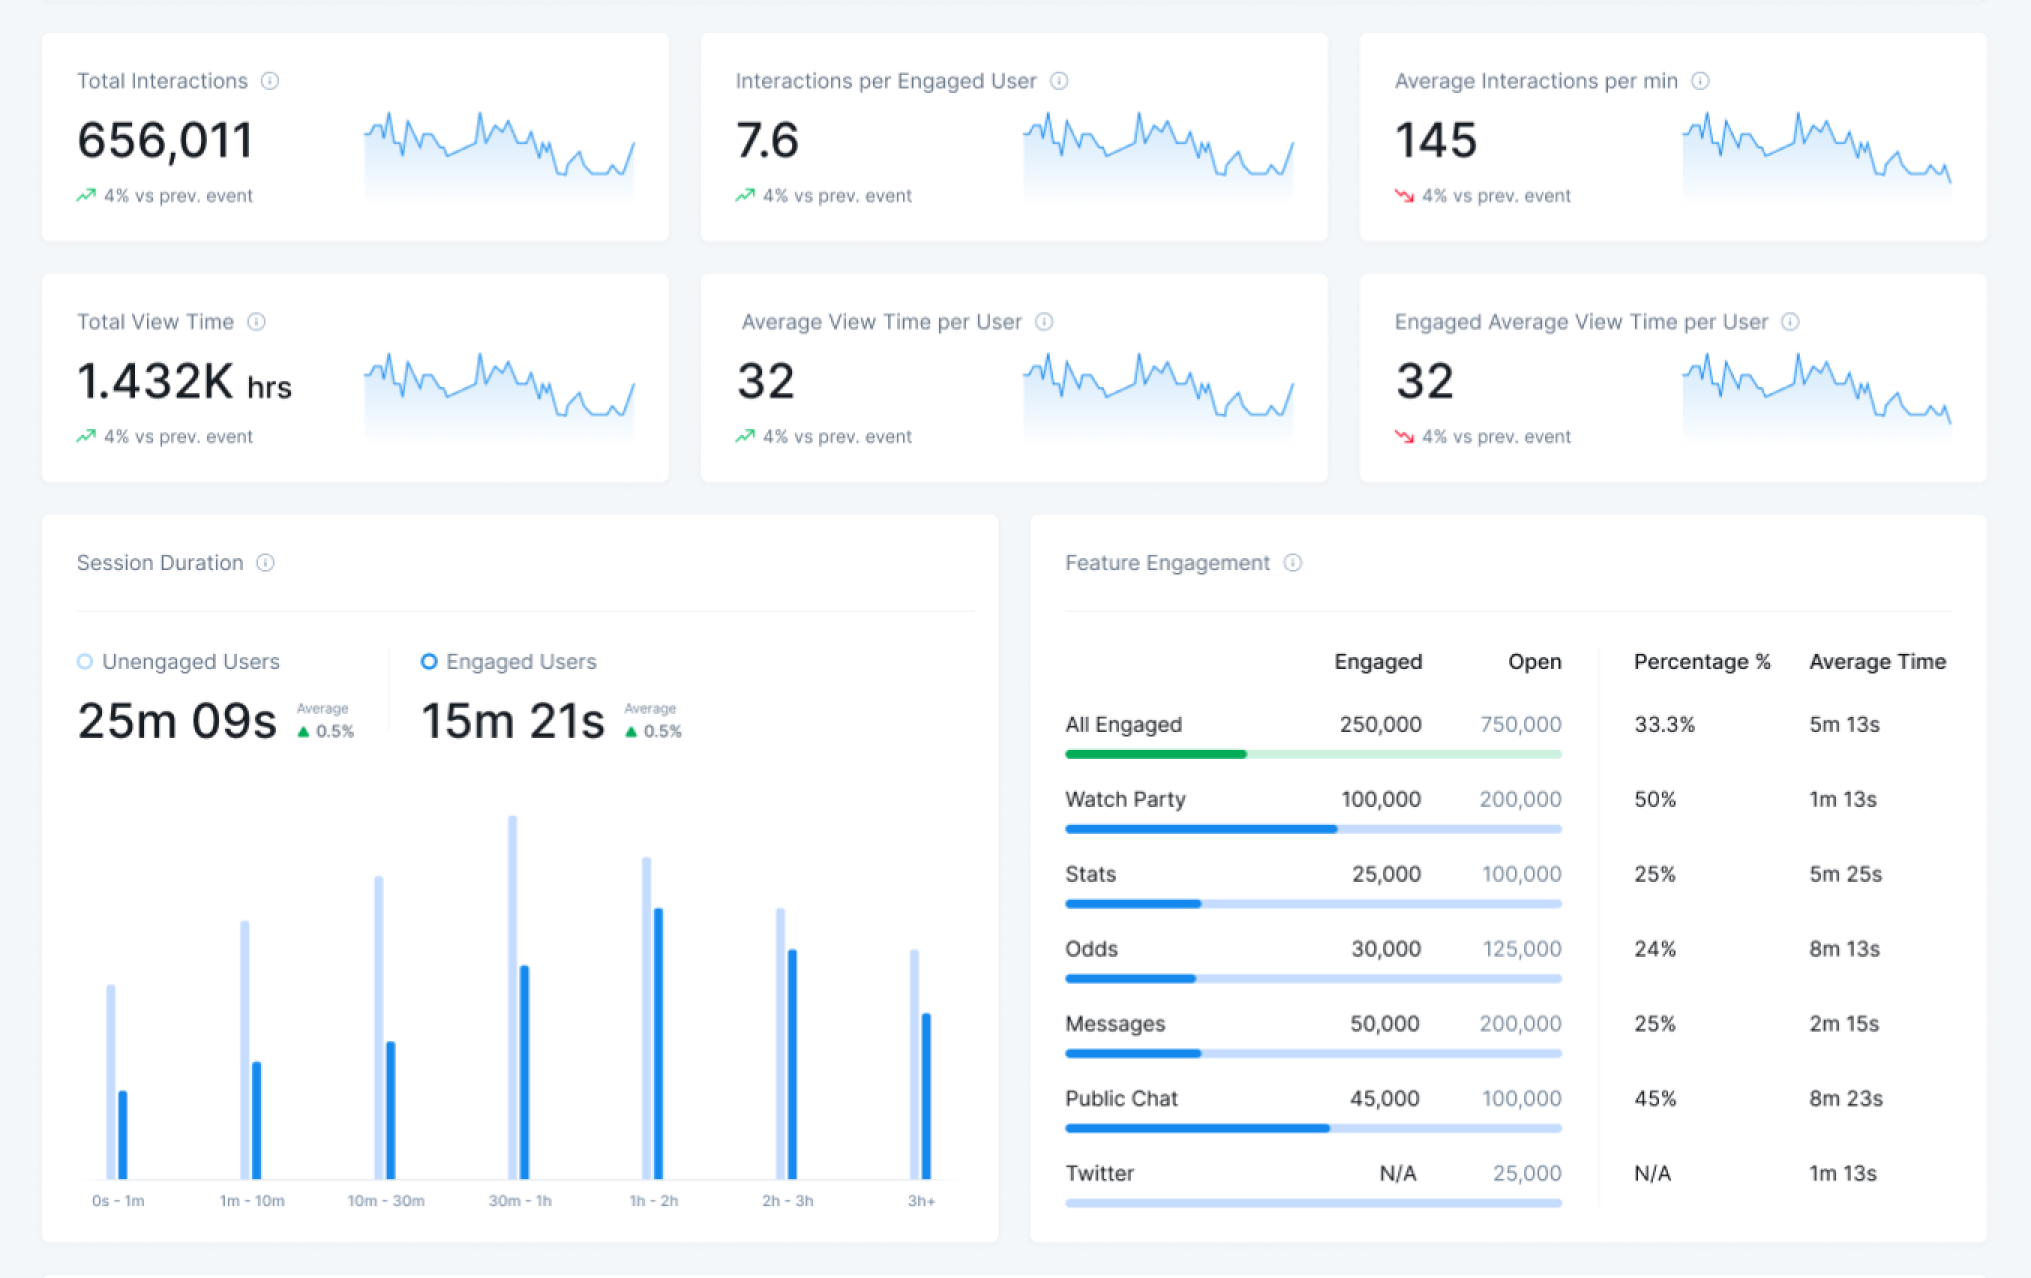
The Extensions Engagement tab is located to the right of the Conversations tab and breaks down user engagement. At a glance you can see how many of your users are using Twitter, viewing stats, looking at profiles, sending messages, and making voice calls.
All Extensions
Total engagement - The definition of an engaged user is a user who activates a StreamLayer Element either by 1) selecting a notification or 2) selecting the launch button then a submenu button. We can count them with the “interaction” tracking event. If a user has at least one “interaction” tracking event fired, that means that we should count them in the “total engaged” metric.
Extension Engaged
The number of users who had any interaction inside the StreamLayer Element (tapped any button, started a call or messaging, tapped a notification, etc). We can count these interactions with the “engagement” tracking event without the HOME suffix.
Extension Viewed
The number of users who viewed each StreamLayer Element but did not engage further. Viewers will always be higher than engagement. We can count them with the “engagement” tracking event with the home suffix.
Percentage
The percentage column breaks down the percentage of engaged versus viewed for each of the extensions.
Average Time
Average time shows the average amount of time a user is spending in the given extension.
Invitations
The Invitations screen breaks down the data about the number of invitations that have been sent out and where in your app they are sending out those invitations.
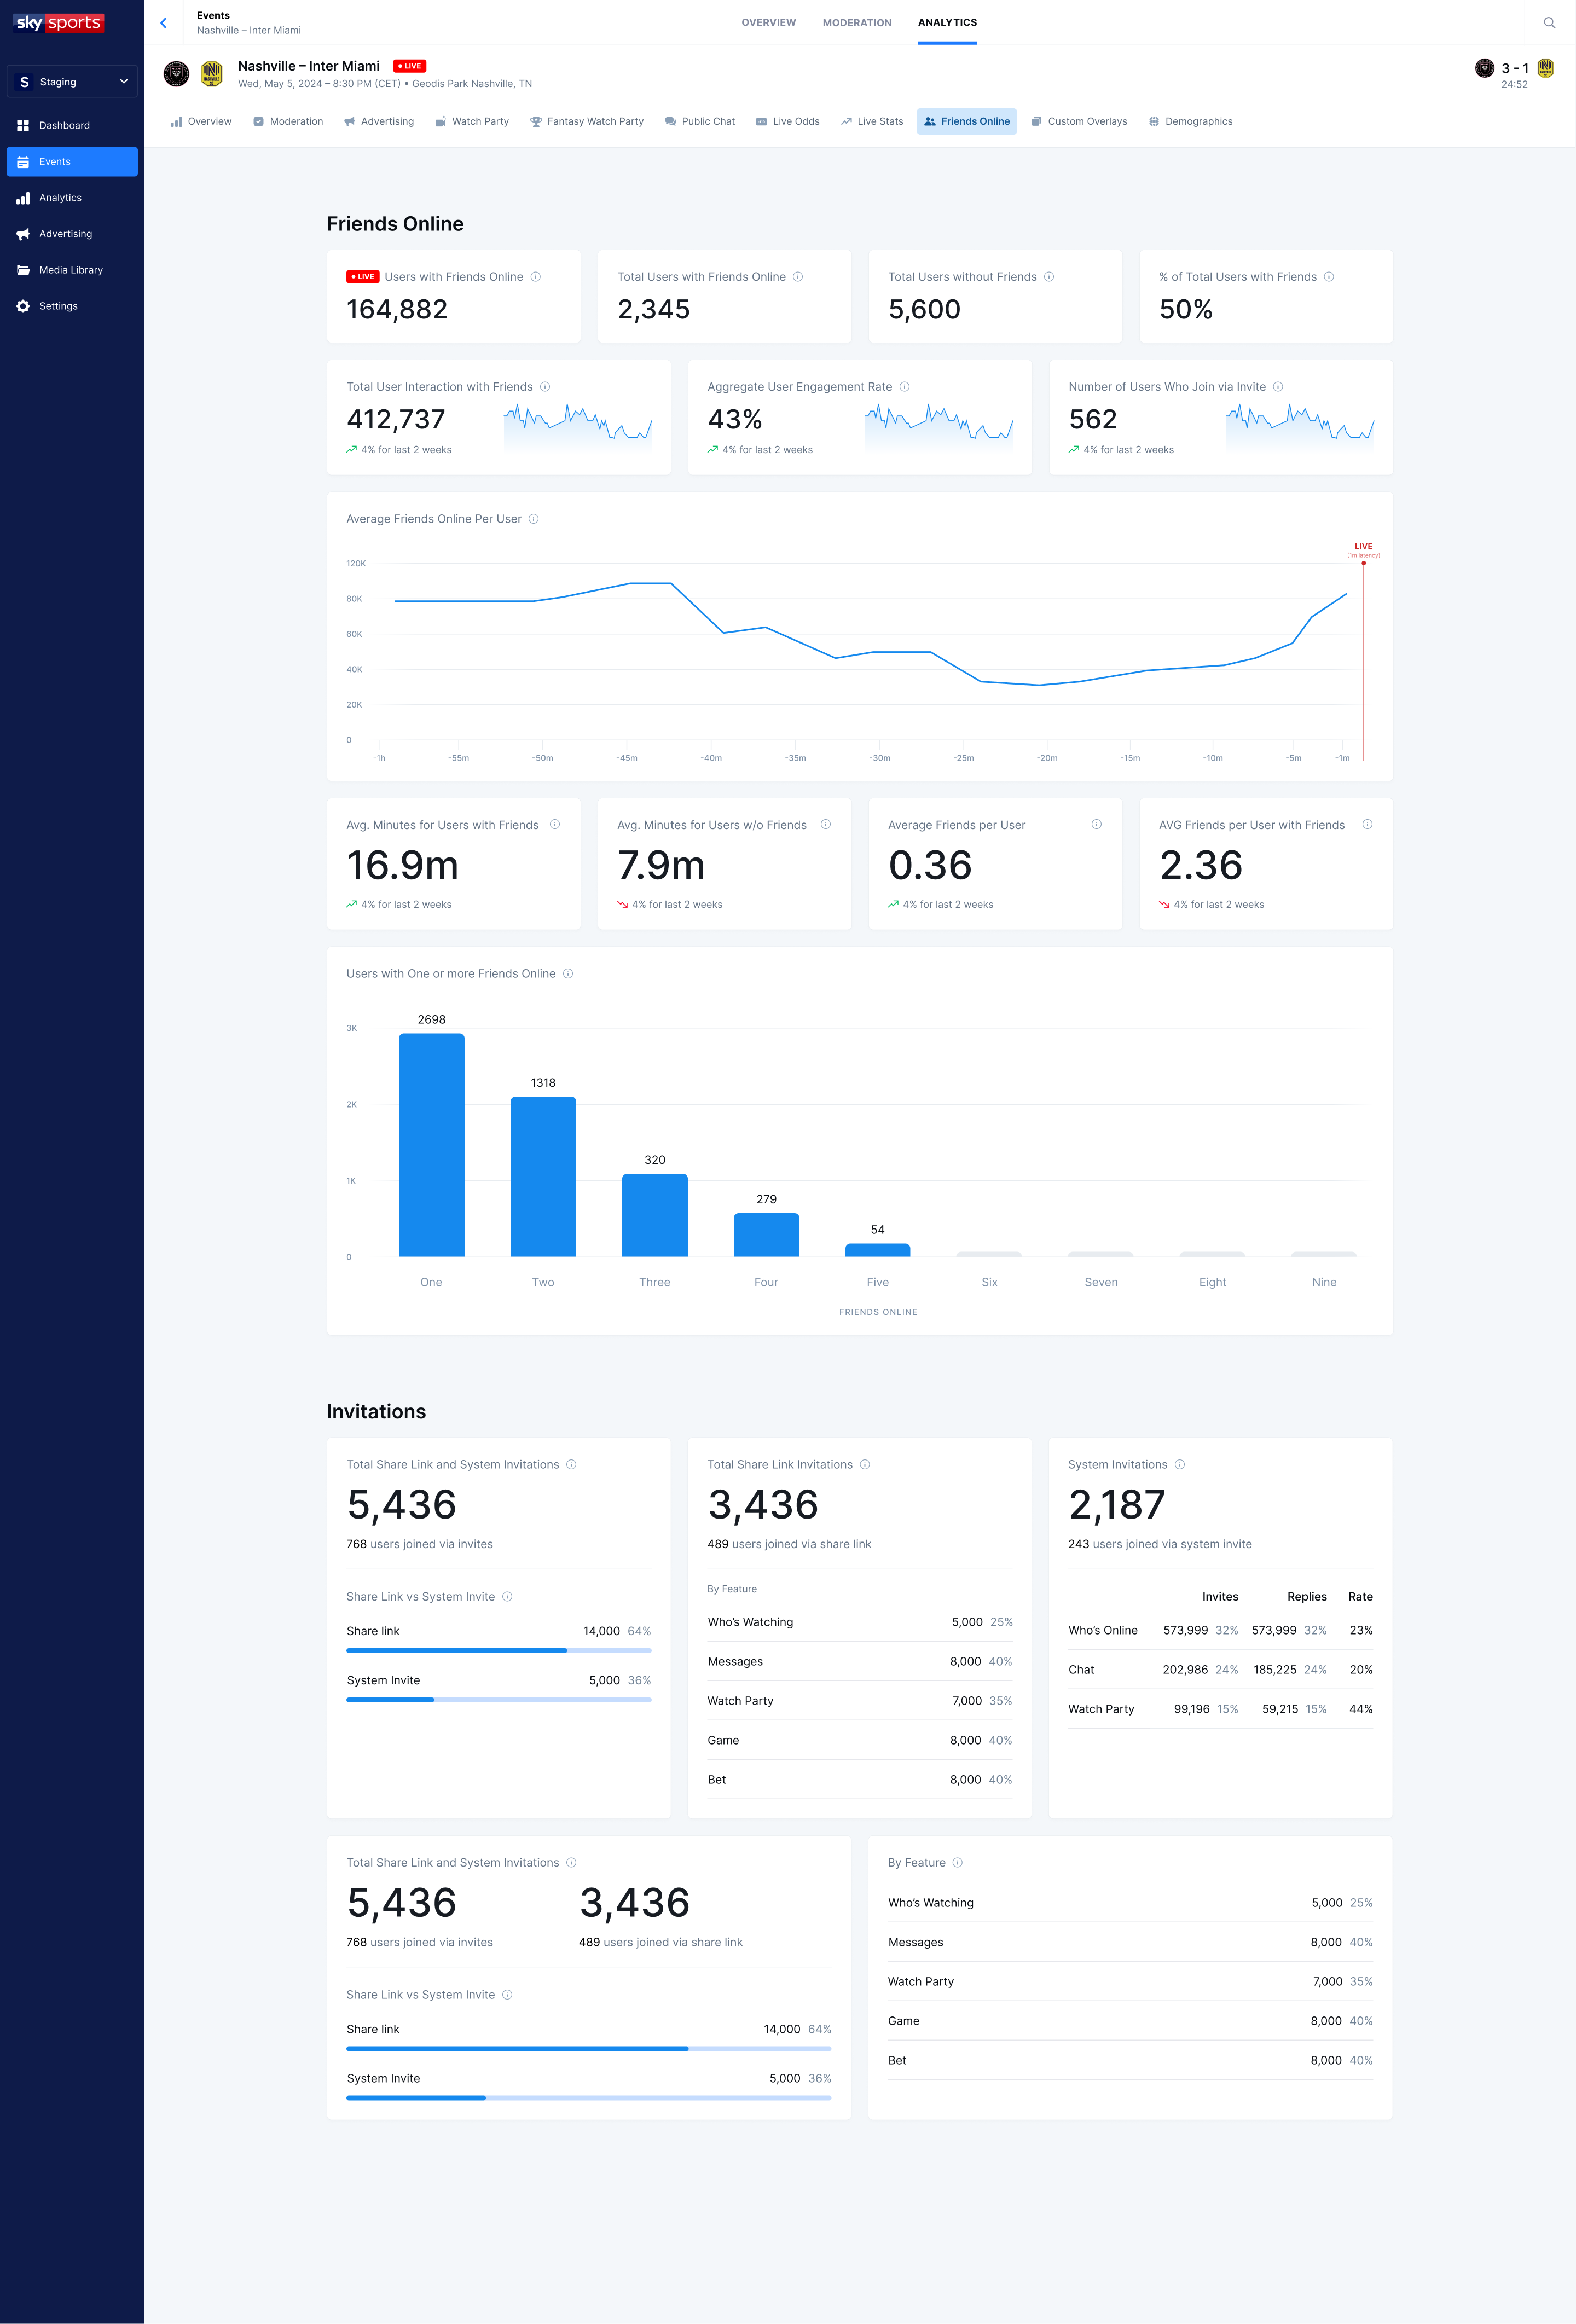
The Invitations screen breaks down the data about the number of invitations that have been sent out and where in your app they are sending out those invitations.
Data Export
As mentioned earlier, the analytics data captured by StreamLayer and shown in StreamLayer Studio can be exported as a .csv file for further analysis. An explanation of the format of the data found in the .csv is covered explicitly in the StreamLayer Studio documentation found here.
Related
- Analytics CSV Export Format — Field definitions and enum references for exported data
- Managing Events — Navigate to per-event analytics
- About StreamLayer Studio — Platform overview and capabilities
Updated 4 months ago